> ## Documentation Index
> Fetch the complete documentation index at: https://docs.bizbone.com/llms.txt
> Use this file to discover all available pages before exploring further.
# Dashboard
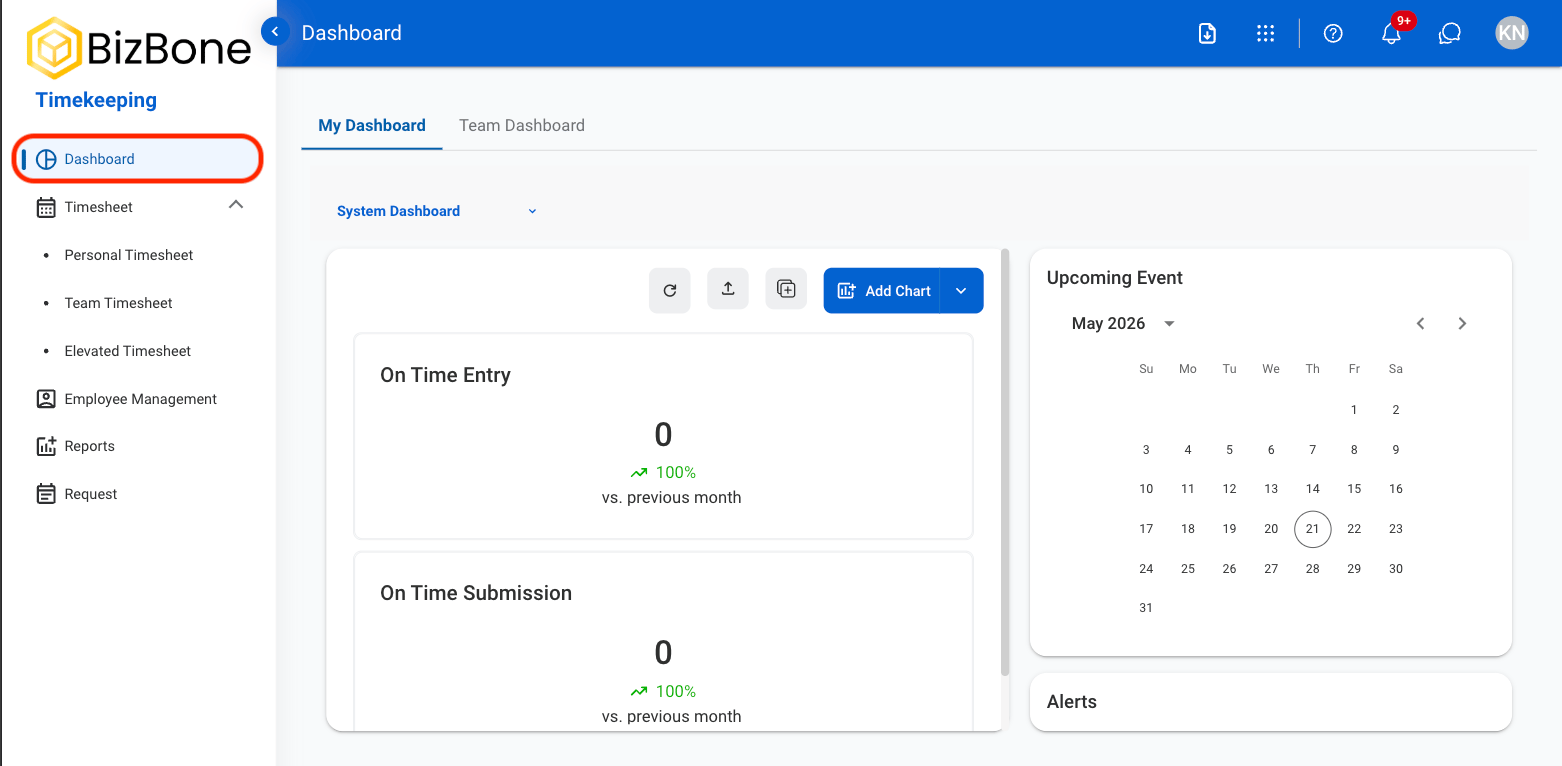
Provides an overview of key timekeeping metrics, attendance activity, and labor tracking data. Customize dashboard views to monitor timesheet activity, leave usage, and timekeeping operations.
## Create a New Dashboard
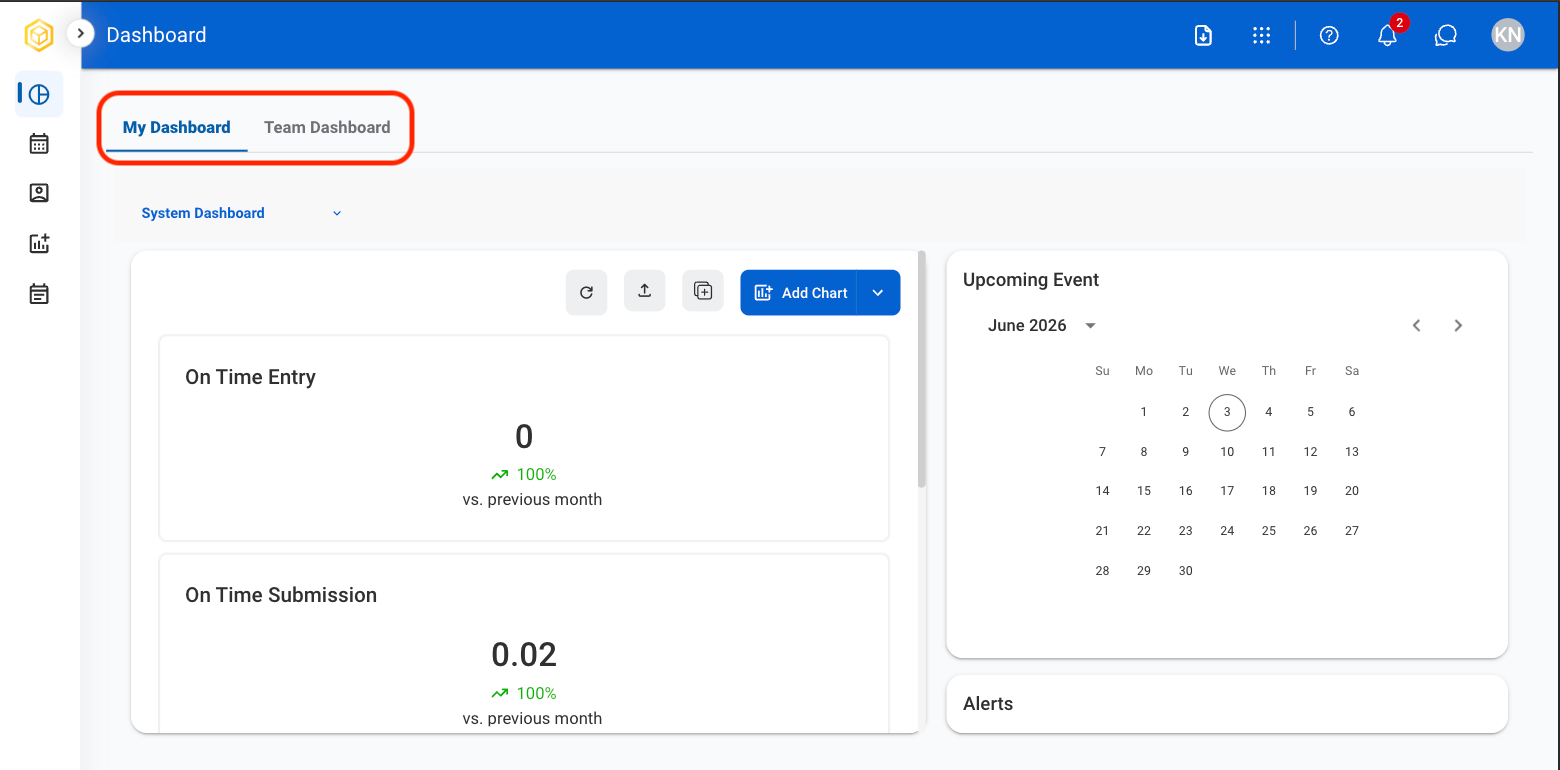 * **My Dashboard:** Displays dashboards created by the current account.
* **Team Dashboard:** Displays dashboards shared with or accessible to a team.
* **My Dashboard:** Displays dashboards created by the current account.
* **Team Dashboard:** Displays dashboards shared with or accessible to a team.
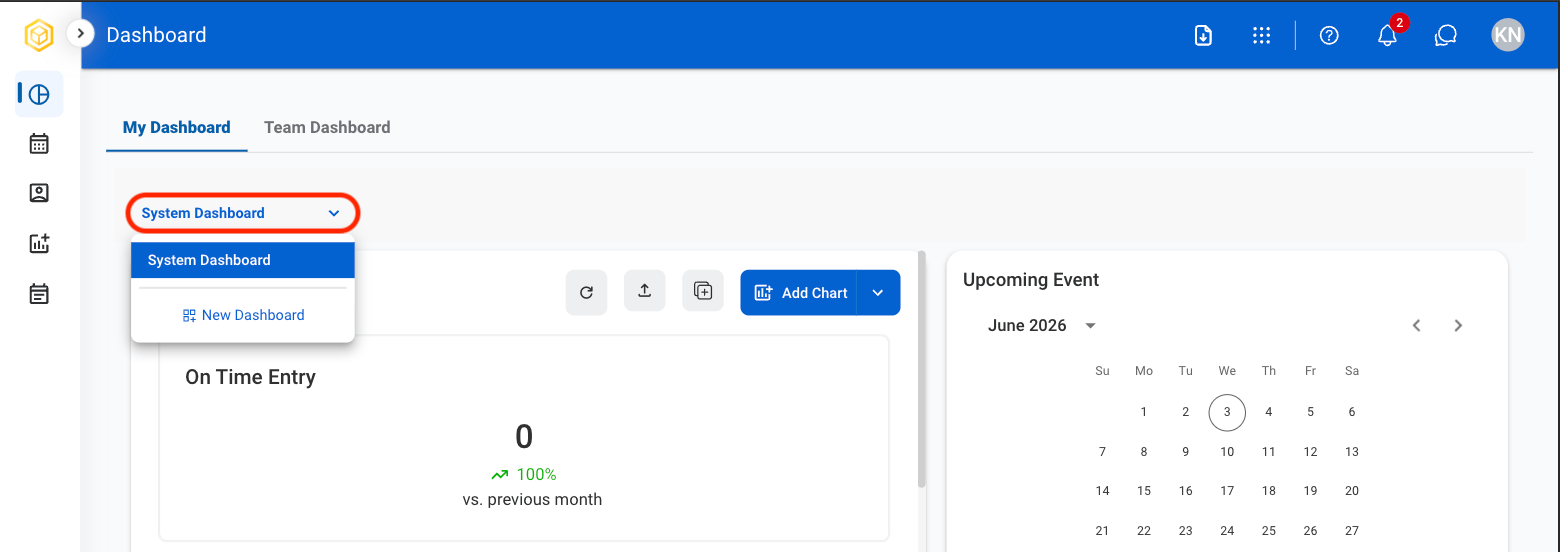
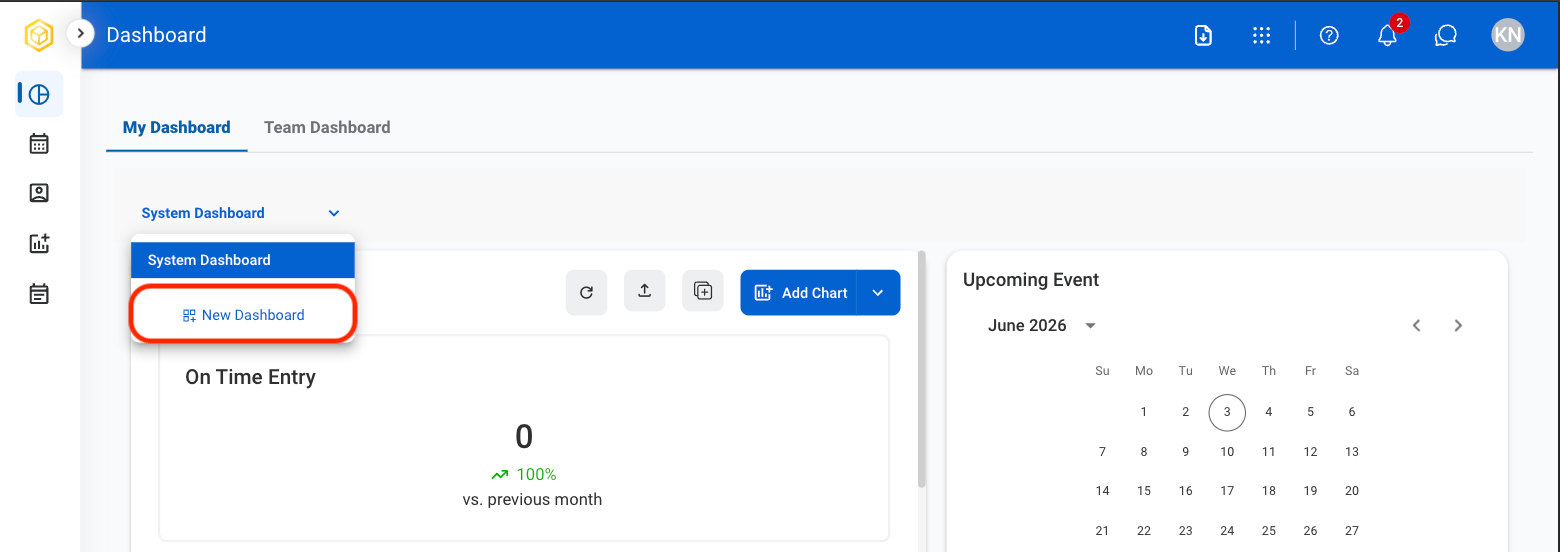
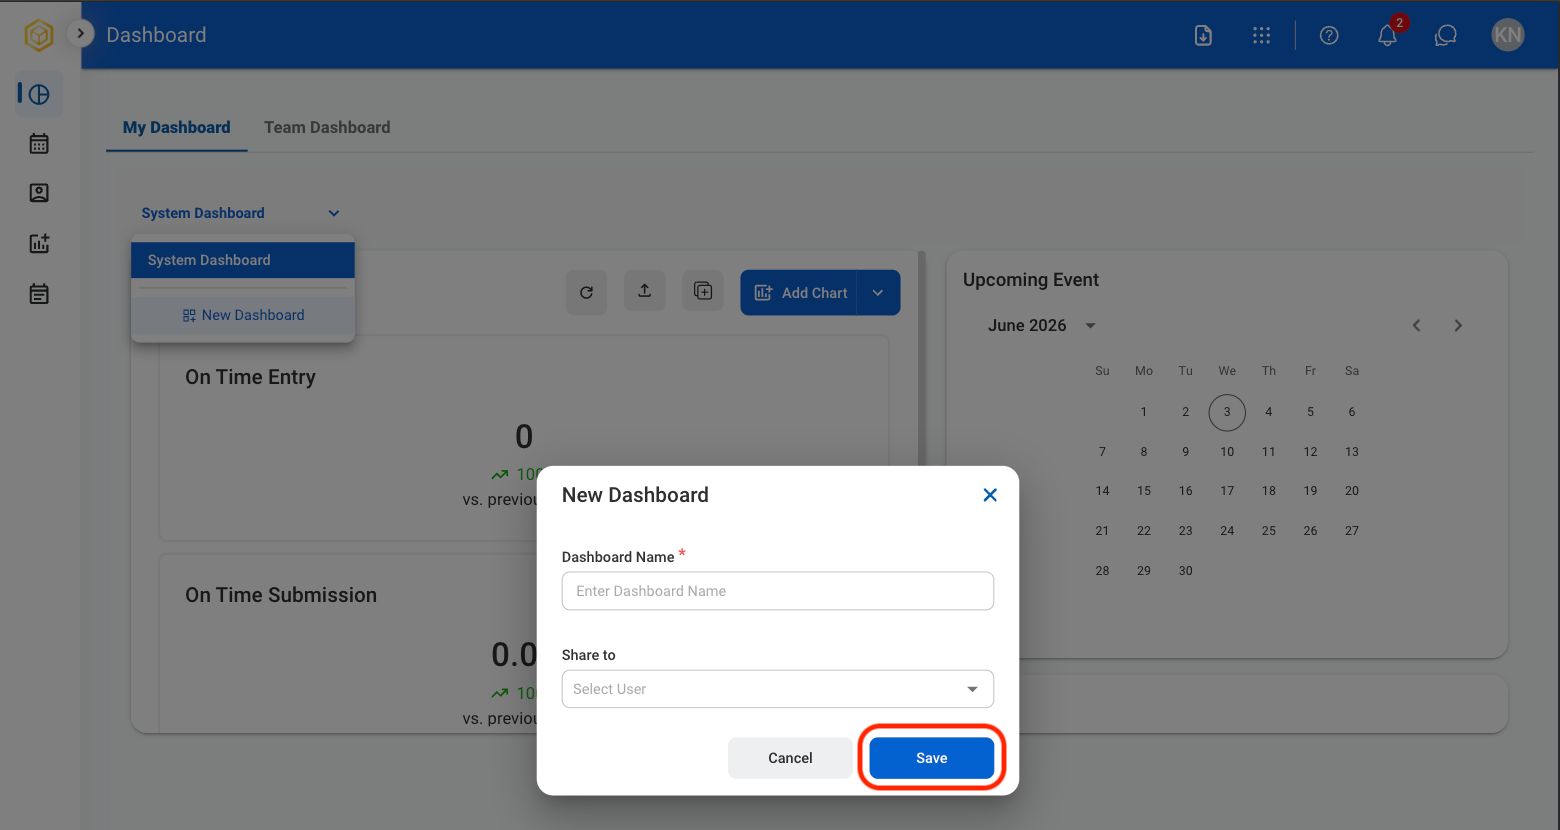 Select **Save** to complete or **Cancel** to exit without saving changes.
## Dashboard Actions
Select **Save** to complete or **Cancel** to exit without saving changes.
## Dashboard Actions
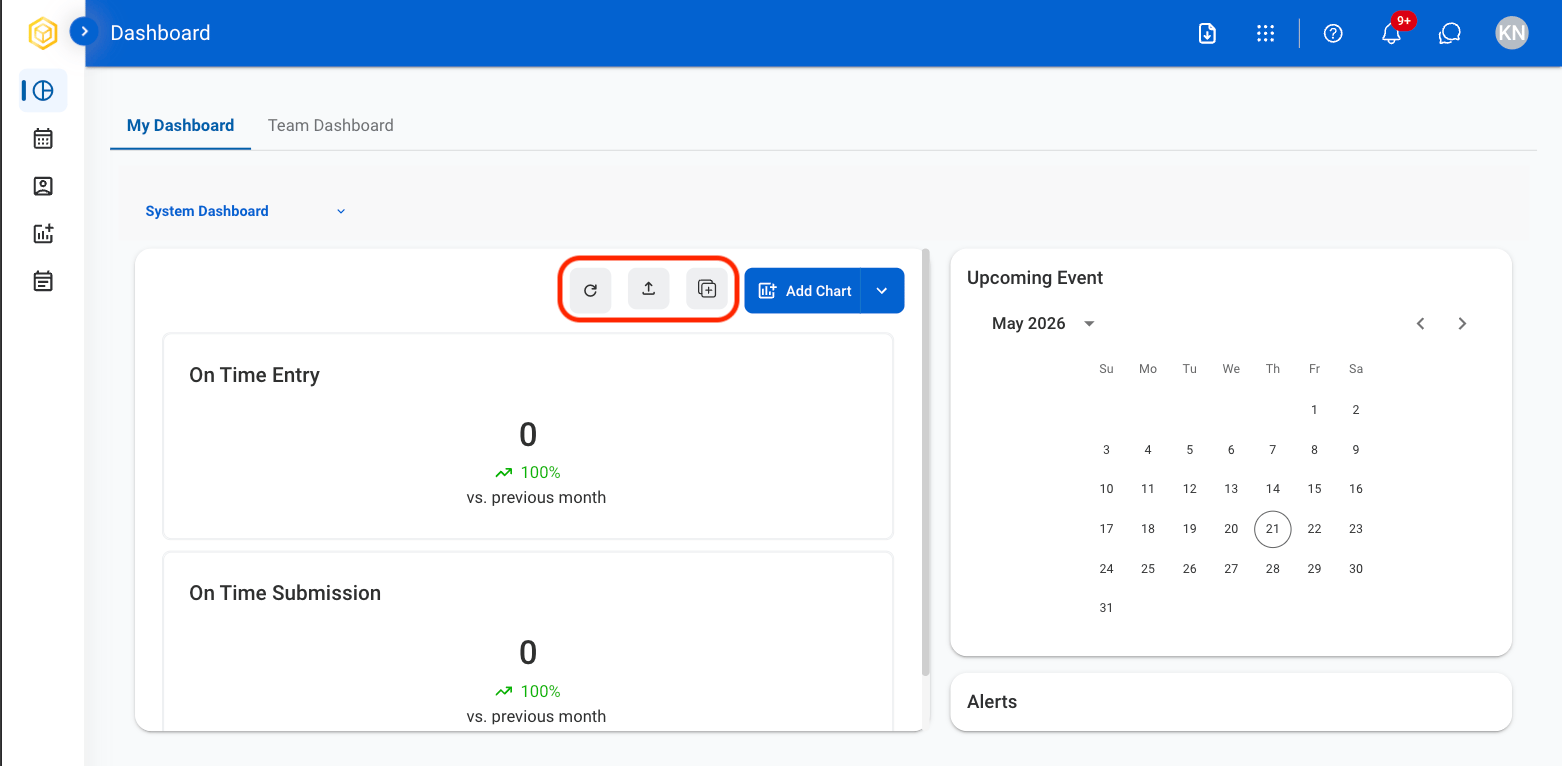 * **Refresh icon**: Refresh the information of the dashboard
* **Export icon**: Export the data
* **Duplicate icon**: Duplicate the dashboard
## Create a New Chart
* **Refresh icon**: Refresh the information of the dashboard
* **Export icon**: Export the data
* **Duplicate icon**: Duplicate the dashboard
## Create a New Chart
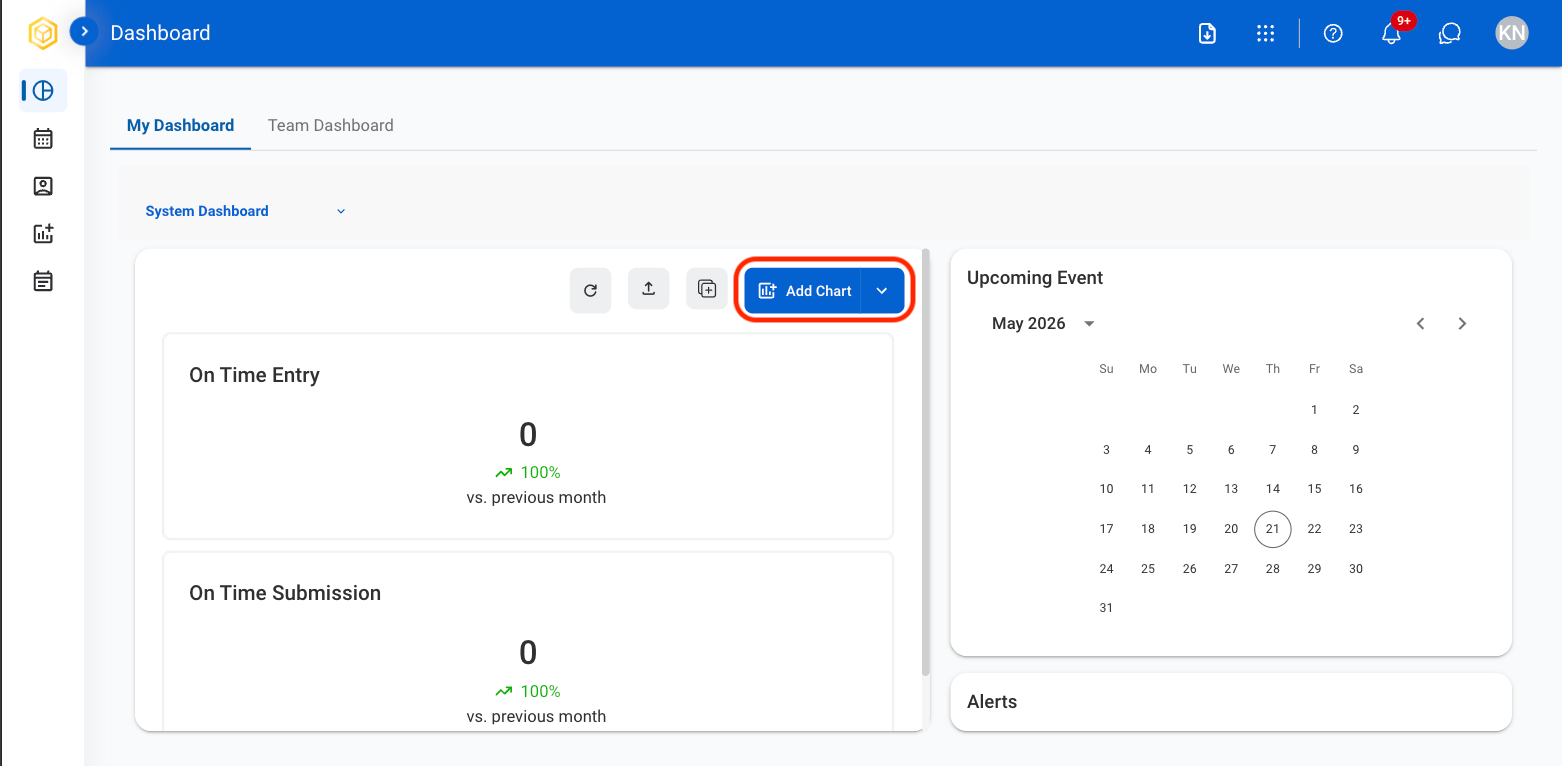
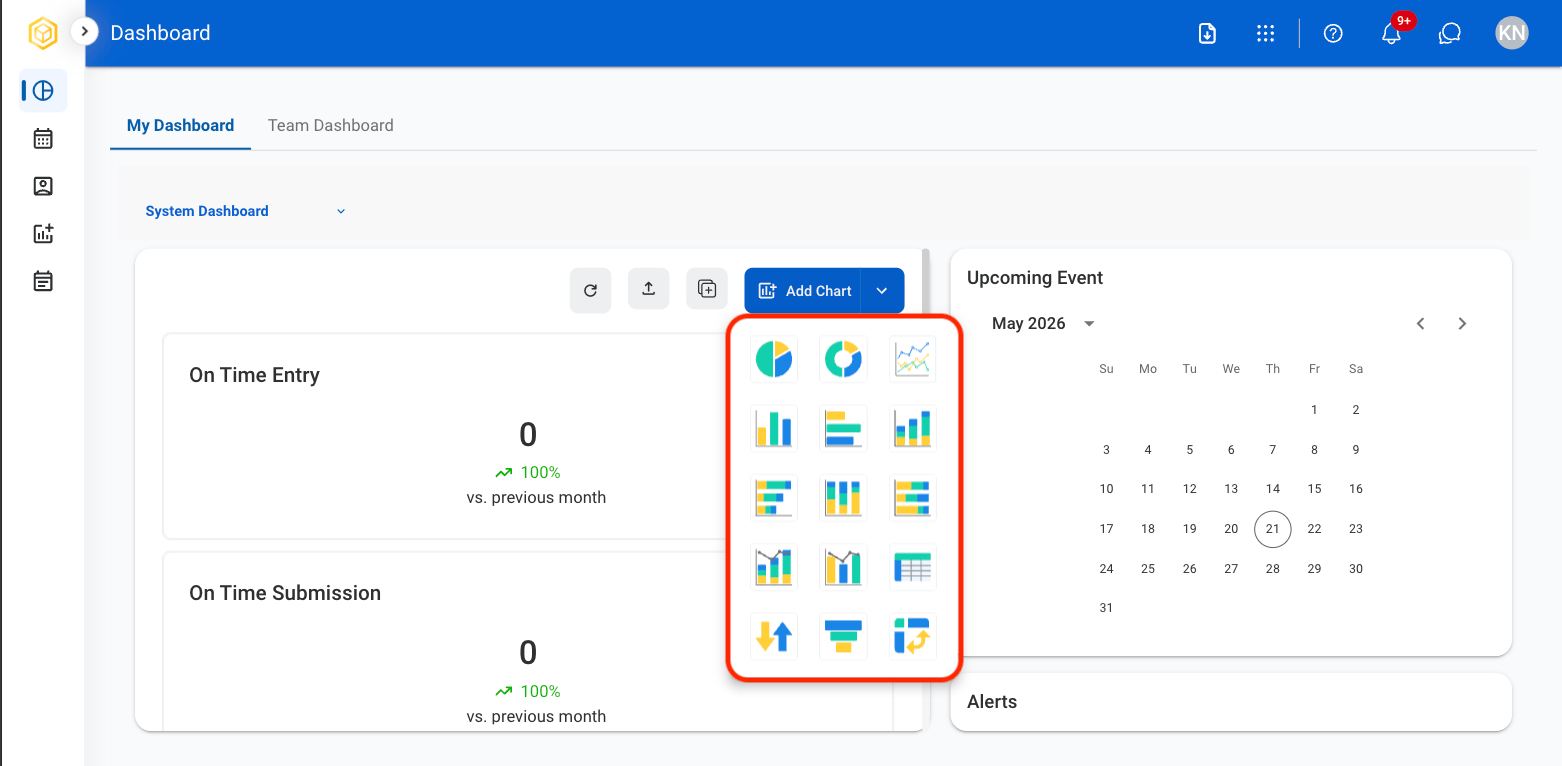
 Select **Save** to complete the chart or **Cancel** to exit without saving.
## Chart Actions
Select a chart to interact with its functions using the following icons.
### Refresh
Select **Save** to complete the chart or **Cancel** to exit without saving.
## Chart Actions
Select a chart to interact with its functions using the following icons.
### Refresh
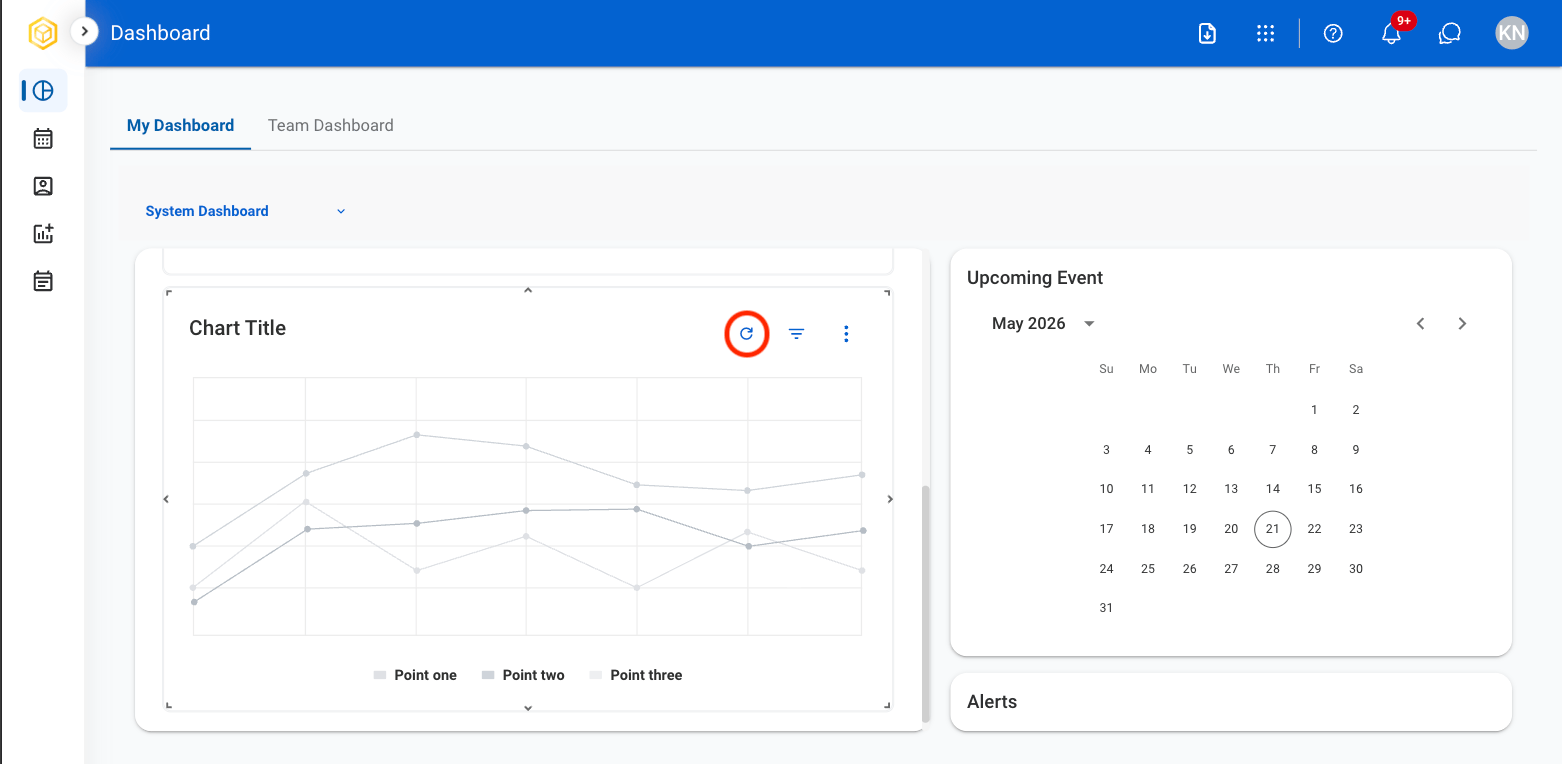 Select the **Refresh** icon to update the dashboard with the latest data.
### Filter
Select the **Refresh** icon to update the dashboard with the latest data.
### Filter
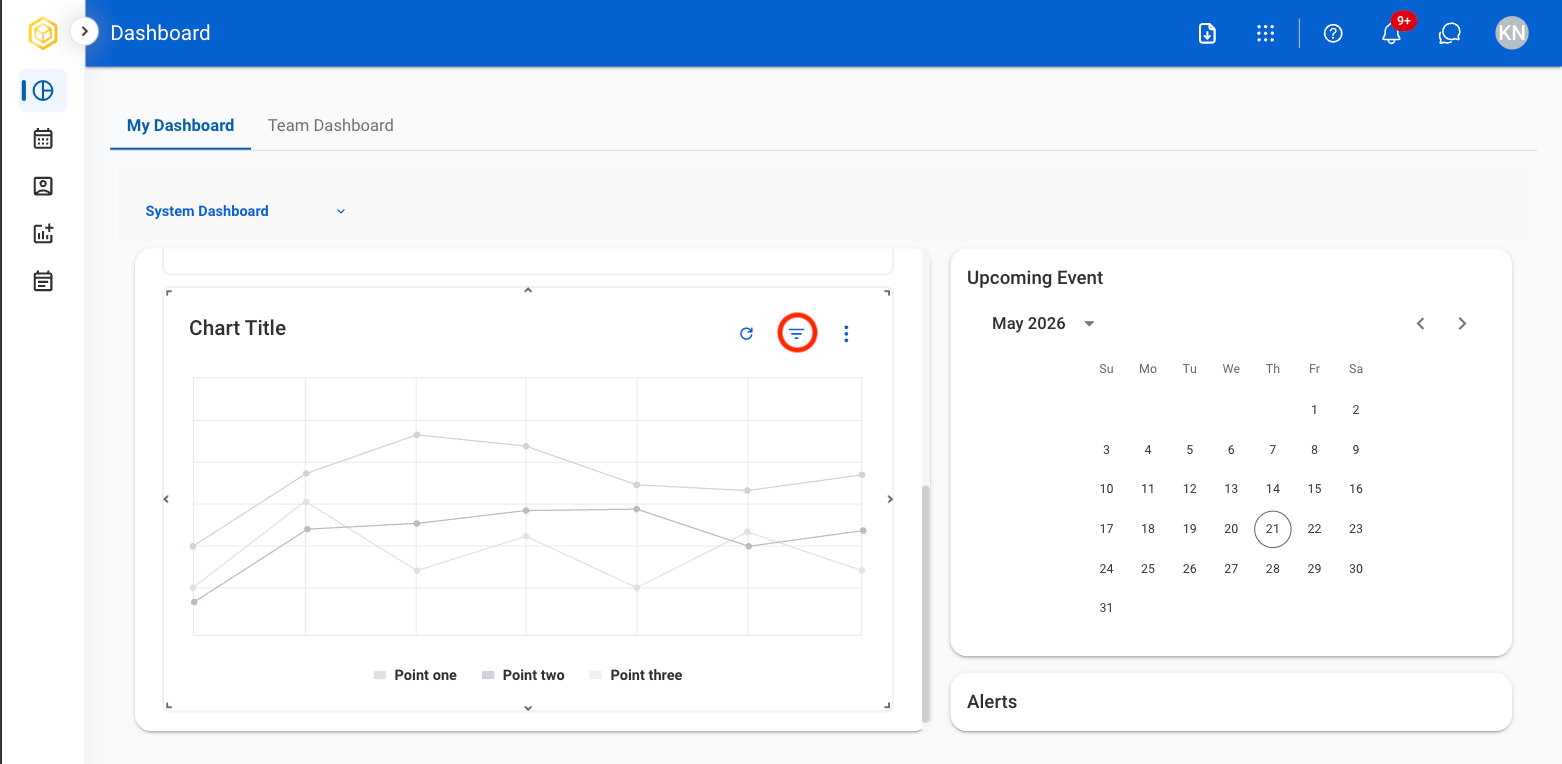 Use the **Filter** icon to filter chart data by category. Select a category to apply or remove it.
### Additional Functions
Use the **Filter** icon to filter chart data by category. Select a category to apply or remove it.
### Additional Functions
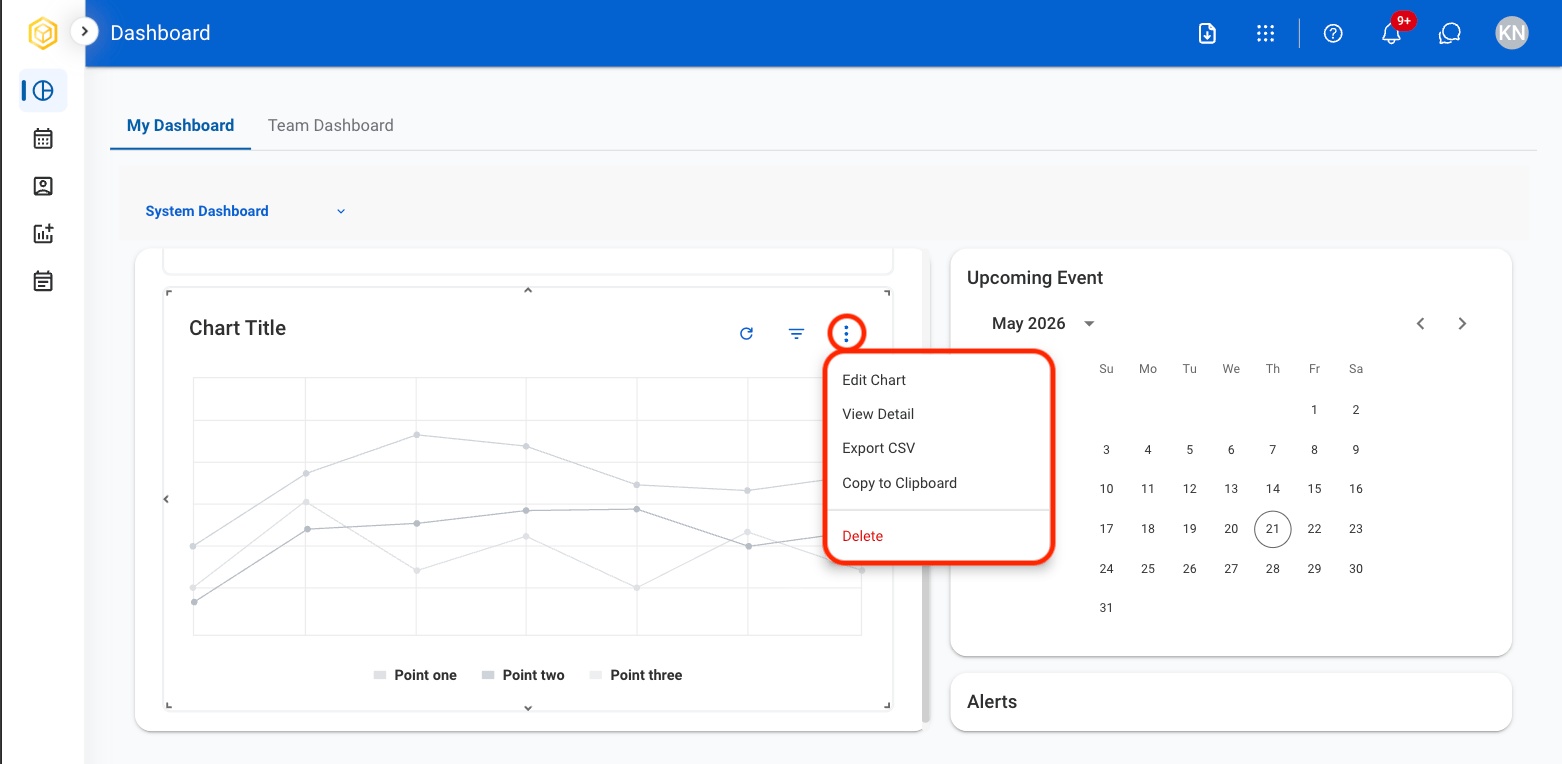 Select the dotted icon to view additional functions.
* **Edit Chart:** Modify chart settings, data, or display options.
* **View Detail:** View the underlying data used to generate the chart.
* **Export CSV:** Export the chart data as a CSV file.
* **Copy to Clipboard:** Copy an image of the chart to the clipboard.
* **Delete**: Remove the selected chart from the dashboard
## View Alerts
View system-generated alerts and notifications related to module activities, requests, approvals, and pending actions.
Select the dotted icon to view additional functions.
* **Edit Chart:** Modify chart settings, data, or display options.
* **View Detail:** View the underlying data used to generate the chart.
* **Export CSV:** Export the chart data as a CSV file.
* **Copy to Clipboard:** Copy an image of the chart to the clipboard.
* **Delete**: Remove the selected chart from the dashboard
## View Alerts
View system-generated alerts and notifications related to module activities, requests, approvals, and pending actions.
 Alerts can be accessed from the dashboard **Alerts** section or the **Notifications** icon in the application header.